
But it doesn’t yet reflect the recent spike in mortgage rates to 4.5%.
By Wolf Richter for WOLF STREET.
OK, the “existing home sales” data released today by the National Association of Realtors was for February, and in February the average mortgage rates were a lot lower than today. In mid-February, the average conforming 30-year fixed mortgage rate had just edged over 4% for the first time since 2019, according to the Mortgage Bankers Association’s weekly index.
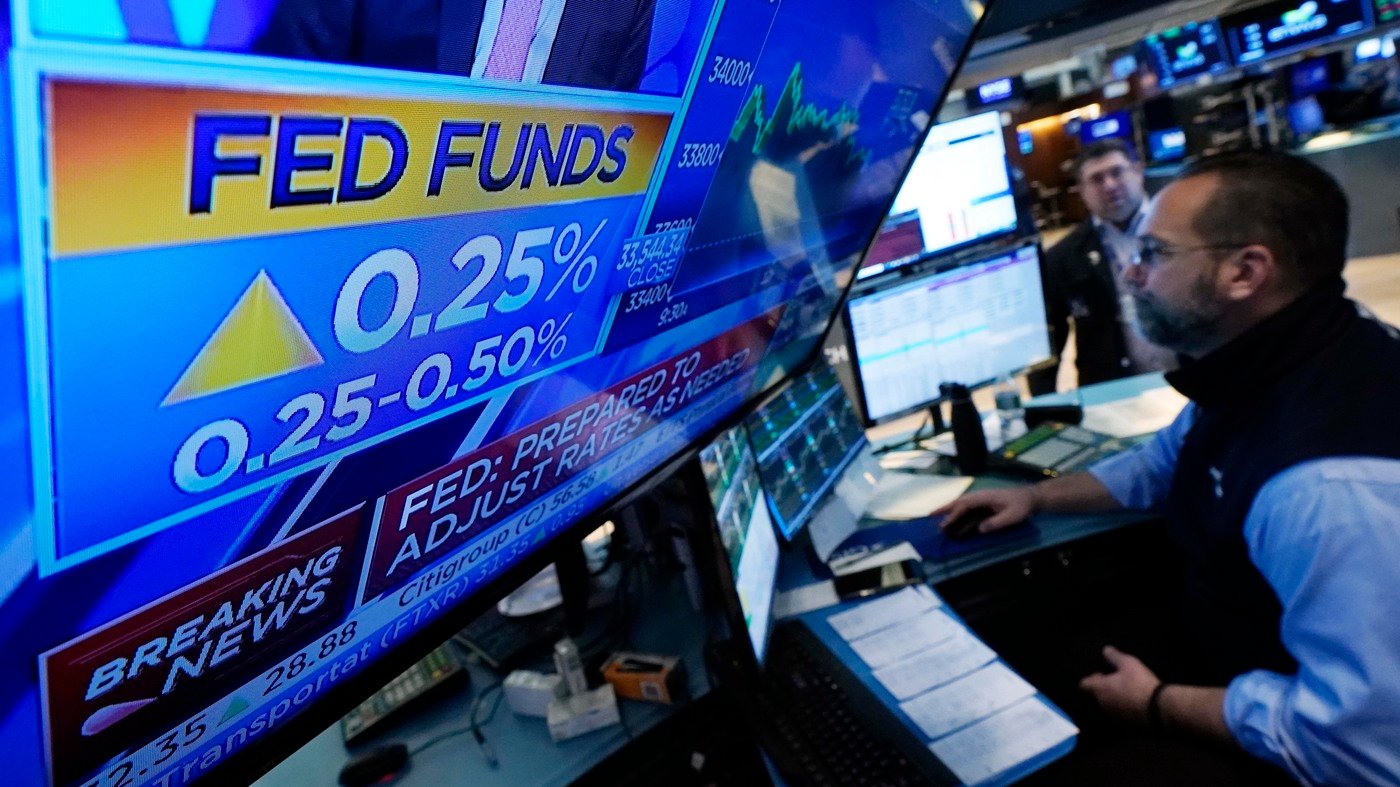
According to the daily measure by Mortgage News Daily, the average 30-year fixed rate mortgage hit 4.50% yesterday, the highest since March 2019. Since last fall, the average rate has jumped by 1.5 percentage points, from 3% to 4.5% ( chart via Mortgage News Daily):
In its report for November, the National Association of Realtors expected the average 30-year mortgage rate to reach 3.70% by the end of 2022. Now it’s only March 2022, and we’re at 4.5% already. This is moving fast. Last month, I speculated that 4% might be the magic number beyond which the housing market is going to feel it.
It’s not a secret: As mortgage rates rise, more and more buyers are priced out at these sky-high prices, and they step away from the market.
But among buyers who still qualify, rising mortgage rates trigger a mad scramble to buy something “now,” no matter what the price and no questions asked, and they’re waving inspections and are taking huge risks – even NPR aired something like a warning about that yesterday, LOL – to lock in whatever mortgage rates are still available before they rise even further.
There is a well-established pattern: Sales activity picks up in the early phases of the cycle of rising mortgage rates, and we saw some of that, but it’s getting impossible for an increasing number of potential home buyers.
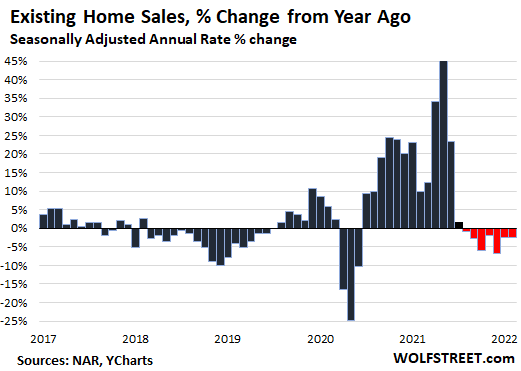
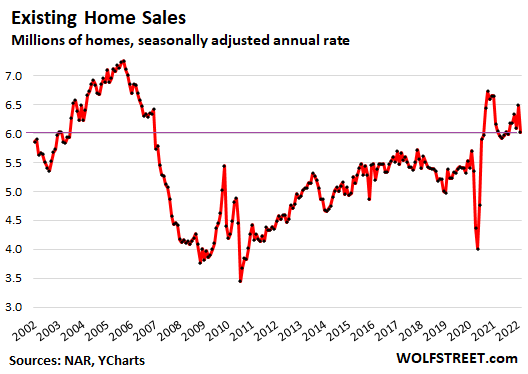
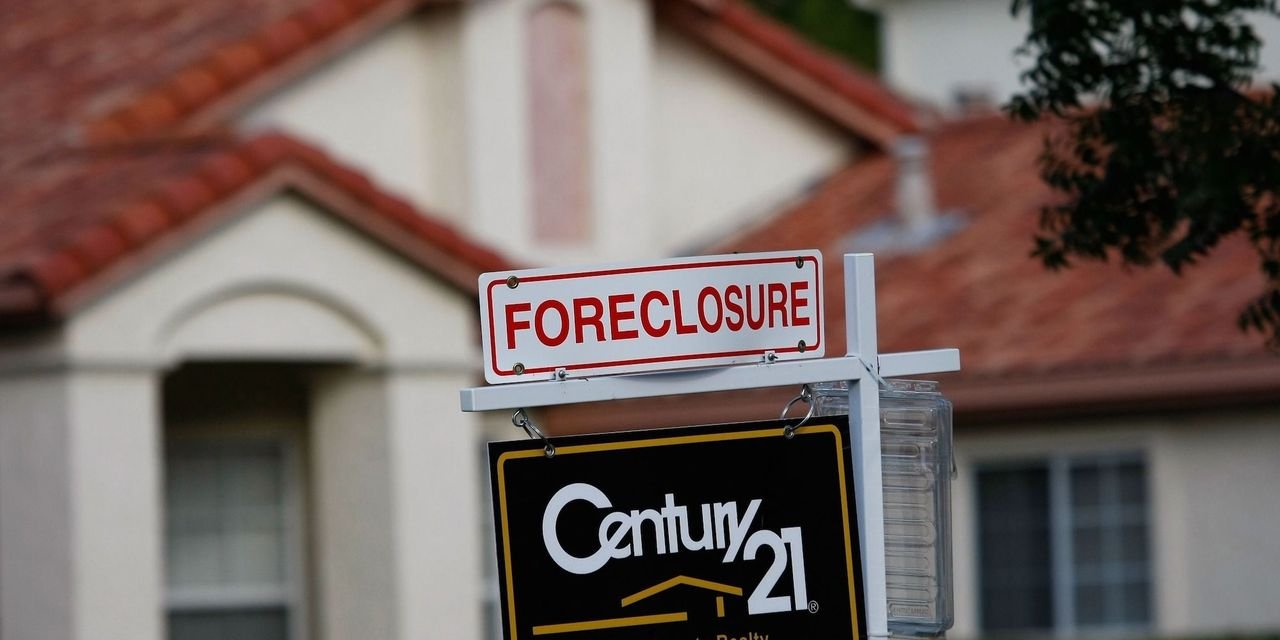
Sales of previously owned houses, condos, and co-ops in February fell by 7.2% in February from January, and by 2.2% year-over-year, to a seasonally adjusted annual rate of 6.02 million homes, the seventh month in a row of year-over-year declines (historic data via YCharts ):
“Housing affordability continues to be a major challenge, as buyers are getting a double whammy: rising mortgage rates and sustained price increases,” the NAR said in the press release. It pointed out that monthly payments had risen by 28% from a year ago. “Some who had previously qualified at a 3% mortgage rate are no longer able to buy at the 4% rate,” the report said.
Home sales peaked in the 2003-2006 era. The current era remains solidly below that peak. The seasonally adjusted annual rate of 6.02 million sales in February was also well below the pandemic peak, but was up from the prior years.
Sales of single-family houses dropped 7.0% for the month and 2.2% year-over-year, to a seasonally adjusted annual rate of 5.35 million houses.
Sales of condos plunged by 9.5% for the month and by 4.3% year-over-year to a seasonally adjusted annual rate of 670,000 condos.
By Regionthe percent change of the seasonally adjusted annual rate of total home sales in February from January, and year-over-year (yoy):
- Northeast: -11.5% from January, -12.7% yoy.
- Midwest: -11.3% from January, -1.5% yoy.
- South: -5.1% from January, +3.0% yoy.
- West: -4.7% from January, -8.3% yoy.
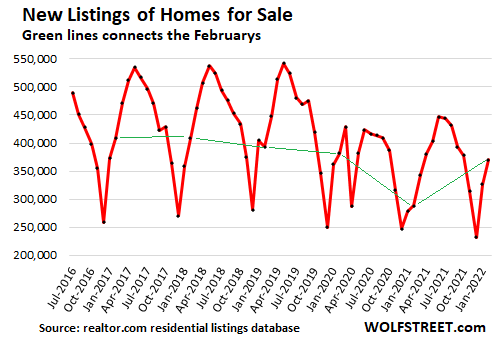
Here come the new listings. The number of homes listed for sale in February jumped by 13.4% year-over-year, after the 13.2% jump in January, and were down only 3.0% from February 2020.
New listings come out of the woodwork when interest rates rise and volume stalls — because it’s now suddenly time to put the extra house on the market before the market turns. In February, new listings essentially rose back to the normal range for a February, after having been woefully low during the past two years. The green lines connect the Februarys (source: realtor.com residential listings database):
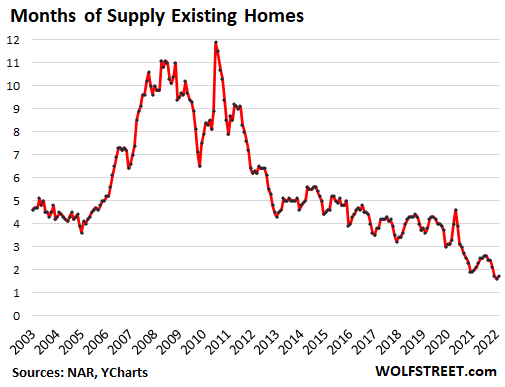
Supply of homes listed for sale ticked up from the record low in January to 1.7 months of sales. The number of unsold homes on the market rose 2.4% from record lows in January to 870,000, seasonally adjusted.
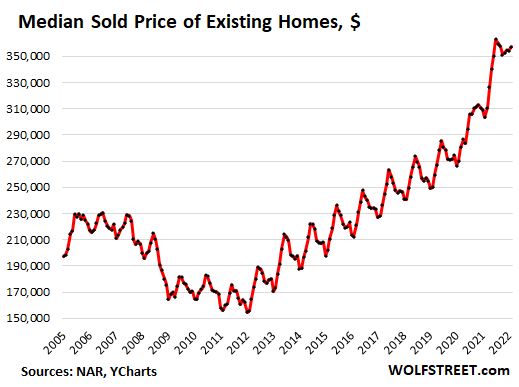
The median price ticked up from January and was up 15% from a year ago, to $357,300. The year-over-year spikes had peaked last May and June at over 23%. The seasonal peak in the median price was in July 2021 at $362,800:

Investor share of sales remains about level. “Individual investors or second-home buyers, who make up many cash sales,” accounted for 19% of the transactions in February, down from 22% in January but up from 17% in February 2021. “All-cash” sales remained in the same range, accounting for 25% of the transactions in February, down from 27% in January but up from 22% in February 2021.
Enjoy reading WOLF STREET and want to support it? Using ad blockers – I totally get why – but want to support the site? You can donate. I appreciate it immensely. Click on the beer and iced-tea mug to find out how:

Would you like to be notified via email when WOLF STREET publishes a new article? Sign up here.
![]()


![“Ghosts” recap: season 2, episode 10 – [Spoiler] To kiss](https://nokiamelodileri.com/wp-content/uploads/2022/12/Ghosts-recap-season-2-episode-10-Spoiler-To-kiss.jpg)


![The Walking Dead Recap: Season 11, Episode 23 — [Spoiler] Die?!?](https://nokiamelodileri.com/wp-content/uploads/2022/11/The-Walking-Dead-Recap-Season-11-Episode-23-—-Spoiler.jpg)


![‘She-Hulk’ Recap: Finale Criticizes MCU Tropes, Introduces [Spoiler]](https://nokiamelodileri.com/wp-content/uploads/2022/10/She-Hulk-Recap-Finale-Criticizes-MCU-Tropes-Introduces-Spoiler.jpeg)


![‘I mean, I kinda agree [with] them’](https://nokiamelodileri.com/wp-content/uploads/2022/03/I-mean-I-kinda-agree-with-them.jpeg)


![TikToker Admits He Lied About Jumping That Tesla to Go Viral [UPDATED]](https://nokiamelodileri.com/wp-content/uploads/2022/03/TikToker-Admits-He-Lied-About-Jumping-That-Tesla-to-Go.jpg)


![‘Good Trouble’: [Spoiler] Leaving in Season 4](https://nokiamelodileri.com/wp-content/uploads/2022/03/Good-Trouble-Spoiler-Leaving-in-Season-4.jpg)


![‘The Bachelor’ Recap: Season Finale—Clayton Picks [Spoiler]](https://nokiamelodileri.com/wp-content/uploads/2022/03/The-Bachelor-Recap-Season-Finale—Clayton-Picks-Spoiler.png)


![‘Upload’ Recap: Season 2 Premiere, Episode 1 — Ingrid Is [Spoiler]](https://nokiamelodileri.com/wp-content/uploads/2022/03/Upload-Recap-Season-2-Premiere-Episode-1-—-Ingrid-Is.jpg)


![[VIDEO] ‘The Masked Singer’ Premiere Recap: Season 7, Episode 1](https://nokiamelodileri.com/wp-content/uploads/2022/03/VIDEO-The-Masked-Singer-Premiere-Recap-Season-7-Episode-1.jpg)


![‘The Bachelor’ Recap: Fantasy Suites, Clayton and [Spoiler] break-up](https://nokiamelodileri.com/wp-content/uploads/2022/03/The-Bachelor-Recap-Fantasy-Suites-Clayton-and-Spoiler-break-up.png)


0